
Live board
Today's Read
Measured, and nothing about him departs from what the market is already pricing.
Model rank
57.9
Market
77.7
Confidence
low
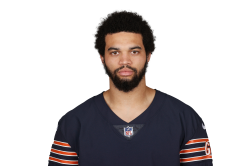
QB · CHI · Bye 10
Elite Profile
Calibrated public rating
Projection
18.1
Half-PPR / game
Market ADP
77.7
Consensus overall
FFT fair value
71.9
Calibrated pick
Draft delta
+5.7
Market minus FFT
Draft recommendation
Target ahead of market
Risk / reliability
Low Risk
Reliability
89 / 99
Coverage
80%
Live board
Measured, and nothing about him departs from what the market is already pricing.
Model rank
57.9
Market
77.7
Confidence
low
2026 week 1
The BALLDONTLIE weekly outlook is unavailable for this player right now. The rest of the profile remains live.
Measured 2026 · Regular season
Loading 2026 results…
Actual BALLDONTLIE box scores · FFT-computed fantasy points · Preseason excluded. Missing stats are not zeroes.
2026 / Player Game Center
Caleb Williams · Recorded performance, game context, fantasy takeaways.
Loading game data…
Measured game log
Actual BALLDONTLIE box scores · FFT-computed fantasy points. Missing weeks are never filled with zeroes.
No 2026 regular-season stat line recorded for Caleb Williams yet.
This view will populate automatically when measured games enter the data spine.
FFT Newsroom
Position-relative
Fantasy Scoring Dominance
92
Elite
Top 4% at QB
Rushing Leverage
79
Strong
Top 8% at QB
Replacement + Draft Economics
96
Elite
Top 3% at QB
Passing Engine
68
Average
Top 17% at QB
Offensive Ecosystem
51
Watch
Top 46% at QB
Fantasy Playoff Schedule
45
Watch
Top 67% at QB
Games
17
Half-PPR
316.18
Total TD
31
The measured inputs doing the most work inside this grade.
Value Over Replacement
+37.3
proj. half-PPR pts
Rank Delta
+3
position spots vs ADP
Value Grade
B+
Good Value
Market
77.7
FFT value
71.9
Board Δ
+5.7
Week 15
@ BUF
Rank 29th
ToughWeek 16
vs GB
Rank 21st
NeutralWeek 17
vs DET
Rank 9th
GreatEvery dot is a real position peer with a market price.
Deep research dossier
The decision dashboard ends above. Open only the research sections you need below—the full evidence remains available without overwhelming the player overview.
Claims written down before the season, sealed at registration, and graded in public — misses kept.
No pre-registered call was made on Caleb Williams. The record holds 29 calls in total, selected from the board by signal strength and divergence — most players do not clear that bar, and silence here means we did not stake a claim on him, not that he graded badly.
What he actually did last season. Measured, not projected.
Games
17
PPR pts
318.2
Half-PPR pts
316.2
PPR / game
18.7
Receiving
Targets
2
Receptions
2
Rec yards
22
Rec TDs
1
Target share
0.4%
Air yards share
-0.1%
WOPR
0.01
Rushing
Carries
77
Rush yards
383
Rush TDs
3
Yards / carry
4.97
Passing
Pass yards
3942
Pass TDs
27
Interceptions
7
nflverse season totals for 2025, joined on normalised name and position (gsis 00-0039918). These are actuals — nothing here is modelled.
Every ADP source we hold, side by side, and where our model sits against them.
Consensus ADP
77.7
Median
75.0
Sources ranking him
3/3
Agreement
Medium
| Source | Rank / ADP |
|---|---|
| Yahoo ADP | 71.0 |
| Sleeper ADP | 87.0 |
| RTSports ADP | 75.0 |
The sources that ranked him disagree by 16.0 picks between highest and lowest (standard deviation 6.8).
Mean and median are computed across the sources that actually ranked him — an unranked source never enters the average, because a sentinel treated as a pick number would drag a real player hundreds of slots. Spread, deviation and agreement are null under two ranked sources rather than 0, since one source cannot agree with itself. The FFT model rank is our own output and is never folded in as if it were an outside source.
Consistency and range — the part a season total hides.
Weeks with a line
17
PPR / game
18.7
Std dev
8.0
Coeff. of variation
0.43
Boom rate
18% (3/17)
Bust rate
35% (6/17)
Best week
38.7 wk 9
Worst week
4.7 wk 7
Recent form — last 4 games with a line
19.9 PPR per game over weeks 15, 16, 17, 18 — +1.2 against his season average.
| Wk | Opp | PPR | Tgt | Rec | Yds | Car | RuYd | TD | RZ |
|---|---|---|---|---|---|---|---|---|---|
| 1 | MIN | 24.2 | 0 | 0 | 0 | 6 | 58 | 2 | 4 |
| 2 | DET | 17.0 | 0 | 0 | 0 | 5 | 27 | 2 | 4 |
| 3 | DAL | 29.1 | 0 | 0 | 0 | 5 | 12 | 4 | 7 |
| 4 | LV | 11.8 | 0 | 0 | 0 | 8 | 13 | 1 | 12 |
| 6 | WAS | 19.9 | 0 | 0 | 0 | 4 | -2 | 2 | 3 |
| 7 | NO | 4.7 | 0 | 0 | 0 | 4 | -2 | 0 | 7 |
| 8 | BAL | 11.8 | 0 | 0 | 0 | 3 | 24 | 0 | 6 |
| 9 | CIN | 38.7 | 2 | 2 | 22 | 5 | 53 | 4 | 7 |
| 10 | NYG | 25.1 | 0 | 0 | 0 | 8 | 63 | 2 | 4 |
| 11 | MIN | 10.3 | 0 | 0 | 0 | 4 | 26 | 0 | 4 |
| 12 | PIT | 21.7 | 0 | 0 | 0 | 4 | 21 | 3 | 3 |
| 13 | PHI | 9.5 | 0 | 0 | 0 | 5 | 13 | 1 | 5 |
| 14 | GB | 14.9 | 0 | 0 | 0 | 4 | 15 | 2 | 9 |
| 15 | CLE | 19.0 | 0 | 0 | 0 | 3 | 13 | 2 | 4 |
| 16 | GB | 21.0 | 0 | 0 | 0 | 3 | 30 | 2 | 4 |
| 17 | SF | 23.0 | 0 | 0 | 0 | 5 | 18 | 2 | 8 |
| 18 | DET | 16.6 | 0 | 0 | 0 | 1 | 1 | 2 | 3 |
The weekly LINES are measured: 2025 game logs, joined on gsis id 00-0039918. Everything derived from them above — per-game, standard deviation, coefficient of variation, boom and bust rates, recent form — is computed by us and carries the FFT model (beta) label. It is not an observed stat.
This whole block is on the PPR scale, including the thresholds — the artifact publishes boom and bust in PPR (QB: boom ≥ 25, bust ≤ 15) and converting only the points would leave the rates measured against a different ruler than the one they were defined on. The hero above is half-PPR because that is what the model ranks on. Two rulers, each labelled, rather than one silently mixed. Rates need at least 4 games to carry weight; recent form is the last 4.
Route concepts, red-zone opportunity, and separation-adjusted catch rate.
RZ targets
1
RZ carries
118
RZ TDs
21
aDOT
—
Concept EPA / target
—
Classified targets
—
Catch residual
—
YAC over expected
—
Every field is derived by FFT from openly-licensed nflverse play-by-play, or taken from the free public NFL Next Gen Stats endpoint. No licensed trial data (Sportradar, BALLDONTLIE) is included, which is why this file can be committed and shipped with the build. Red zone: Plays snapped inside the opponent 20-yard line. Red-zone usage measures opportunity; this repo’s own backtest shows it adds little on top of plain volume, so it is retained as context and is deliberately not described as an edge.
The component projection behind the headline number, and what it was built from.
Projected games
16.3
Half-PPR (season)
295.4
PPR (season)
295.7
Confidence
high
Proj targets
0.8
Proj receptions
0.5
Proj rec yards
1
Proj rec TDs
0.1
Proj carries
73.8
Proj rush yards
351
Proj rush TDs
5.6
Proj pass yards
3719
Proj pass TDs
24.5
Proj INTs
8.2
Touchdown regression
He actually scored 31 touchdowns last season. Against his measured opportunity the model expects a change of -0.8. The gap between what a player scored and what his opportunity implies is one of the four signals the edge engine reads.
What this projection was built from
17 g in 2025, 33.4 att/g, 99% snaps (regressed to the role, not the position), QB1 on depth chart, age 25
fft-projection-2.3.0-beta. The model reads measured production, opportunity and age, and reads no ADP field at any stage — so it can disagree with the market, which is the only reason a disagreement is worth anything. Draft capital was not resolved for this player, which the model treats as unknown rather than as undrafted.
Which sources answered for this player, and which did not.
Model run caveats
How the model works
Inputs, method, and the forbidden-inputs list. It reads no ADP at any stage.
Where it loses
Pre-registered calls, graded in public, misses kept on the page.
Model Rankings
Every player, with the model's BUY / FADE call against consensus ADP built into the board.